Introduction
Nobody likes reading long texts. Audiences prefer visuals over written text. Infographics are used to simplify complex information. They make it easy to digest long data. With infographics, you can make your content easy to understand for reader. Whether you’re a marketer, educator, or a business owner, learn how to make an infographic. This skill will help you communicate your message easily. This blog is a step-by-step infographic tutorial to help you learn about how to make an infographic. It has all the design principles and the best tools for infographics. You will also find some of the upcoming infographic trends. Let’s make an infographic that can engage the audience with its visual impact. In this blog, we offer some simple yet fruitful infographic design tips that can help you stand out.
Why Use Infographics?
You learn how to make an infographic to simplify the data. Infographics use data and turn them into easy visuals. You will see people using infographics in their presentations. They are there on social media for marketing purpose. Learning how to make an infographic can improve user interaction. The benefits of infographics are insane. It doesn’t only simplify data but holds the audience’s attention. Many effective infographic examples prove how an excellent visual support communication. The future of infographic trends focuses on animated and interactive visuals. To stay ahead in the competition, we must learn about modern infographic design principles. This is a continuous process. As time passes, new trends will come and take over the existing ones.
Benefits of Using Infographics
Enhanced Readability

One of the most important benefits of learning how to make an infographic is enhanced readability. When the content is not easy to read, it is not appreciated. Infographics take the stress away by making complex information easy to understand. With infographics, the data is more accessible. You can now turn large data into appealing visuals easily. Instead of spending time reading long texts, viewers can now easily understand key concepts. It provides a structured layouts to content using headings, images and icons. This makes it easier for readers to process data. Infographics bring value to subjects that require technical understanding. You can also use them to present your research findings and business reports.
Higher Engagement
Visual content draws more attention than written text alone. The speed at which our brains process visual information exceeds 60,000 times that of text. This proves infographics as the ideal tool to grab attention. The effective design of infographics allows users to engage more deeply. The content easily gets across different digital platforms. Viewers remain interested because the careful use of strong colors. The graphics and the concise content create a compelling visual experience, making audience to take the action.
Better Retention

Visual communication has a stronger impact on memory retention. Viewers hold 80% of visual content and retain only 20% of text content. Infographics work for storytelling. It helps people remember information more easily. Presenting data using clear graphs help readers retain information. You can use infographics for to explain a complex topic, a business report or marketing campaign. They all benefit from infographics.
Boost Shareability

Users find infographics exceptionally shareable. You can post it on social media network, on websites or online blogs to reach wider audience. Infographics has visual elements that catch the eye. They are also easy to understand which makes them pop out. With infographics, you can find both the text and visual in one format. They are easily shared on different networks. Infographics are bite-sized content suitable for Instagram stories, LinkedIn posts, as well as Pinterest pins. They are useful because they help boost brand awareness and content marketing performance.
Transform Your Brand with Expert Design!
Looking for high-quality designs for your brand? Get in touch with our expert designers today!
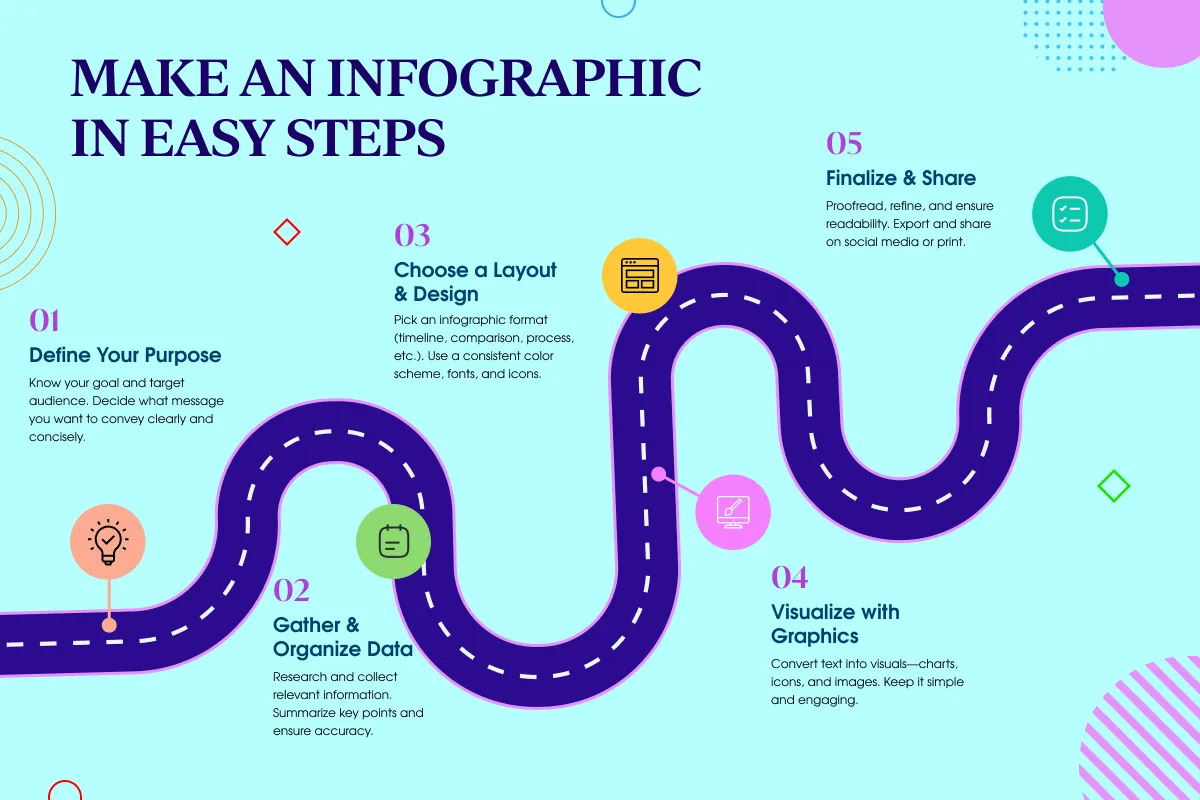
How To Make an Infographic In 13 Simple Steps
Step 1: Define Your Purpose

Define your main objective before creating infographics. Which goal do you want to achieve? Do you want to explain a process, present a research or compare statistics? Your goal defines your design choice. If you want to know how to make an infographic, fix a goal and stick to it. Your content needs proper structure. It will only leave an impact when it is according to standard infographic design principles.
Questions to Ask Before Designing

- What message should people take away from the content?
- Who is your target audience?
- What specific course of action do you expect from viewers?
- What distribution channels will you use for your infographic (social media websites and print)?
Step 2: Gather and Organize Data

Data integrity is one of the fundamental elements of creating effective infographics. To gather the data, make sure you use credible sources. Analyze it to create a logical infographic structure. If you are gathering numeric data and wondering how to present it, know that an infographic is the best source. Data visualization in infographics helps people understand statistical information more easily. A well-designed infographic displays complicated data in an engaging way.
How to Simplify Complex Data for Infographics
To learn how to simplify complex data, identify key takeaways. For example, target critical points. This way, the information will not exhaust the viewer. When we remove unnecessary details, we achieve increased readability. The content in infographics should be concise. By using bullet points together, it is easier for viewers to understand the information. For numerical data, different charts and graphs can be used. Visual charts and graphs help better understanding the data. In this how to make an infographic guide, the aim to is organize the content. To add a flow that is logical. By organizing all the elements in a logical pattern, the content becomes easy to read and understand.
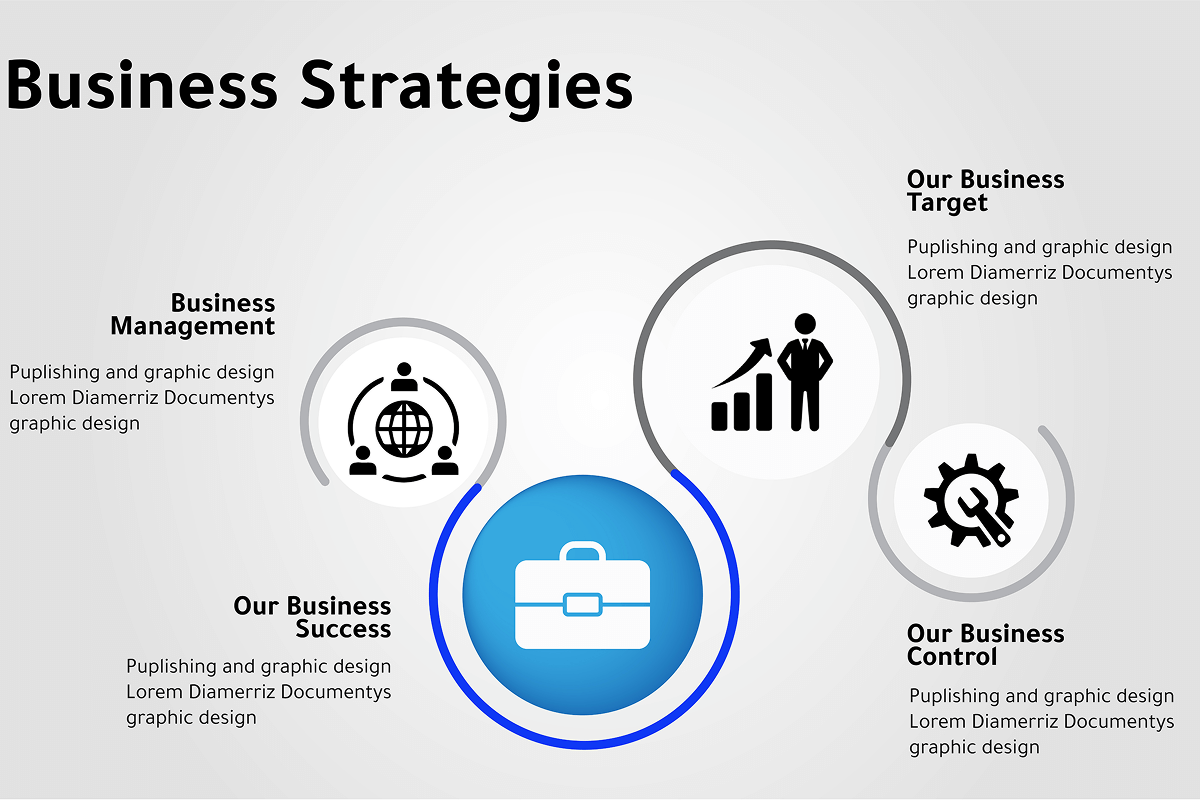
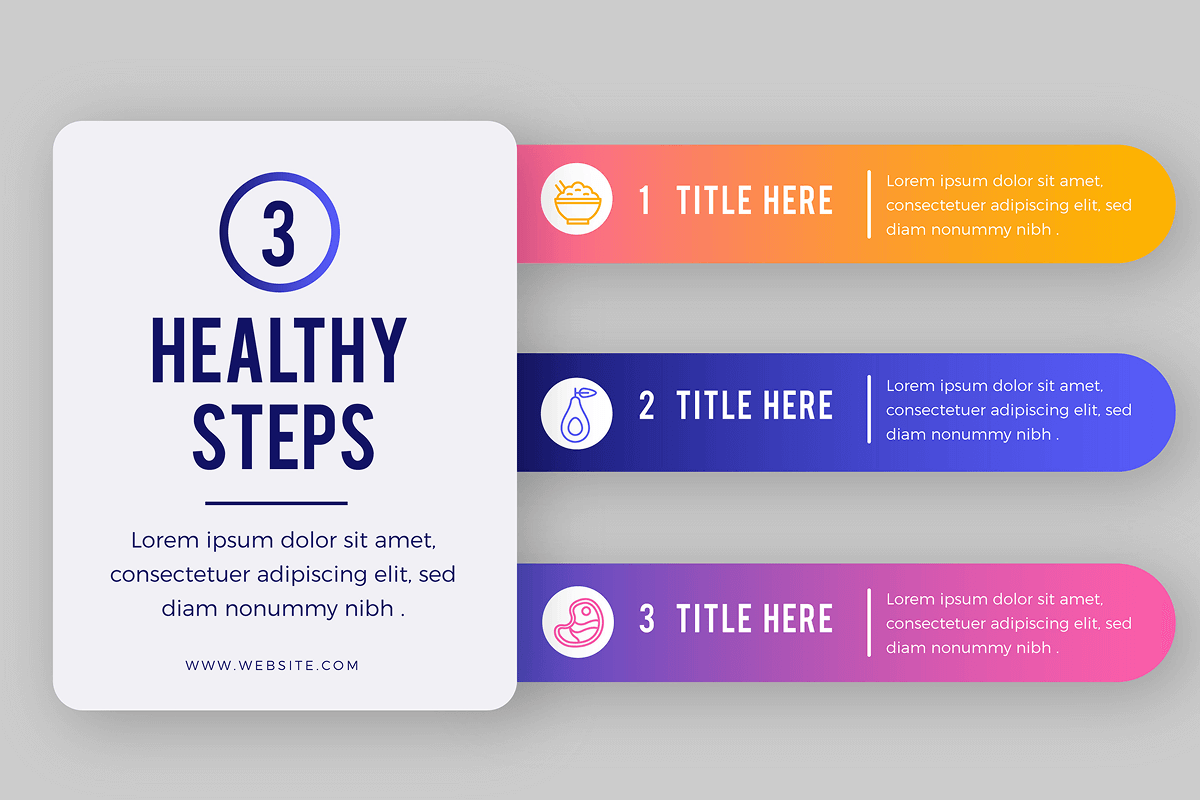
Step 3: Choose the Right Infographic Type
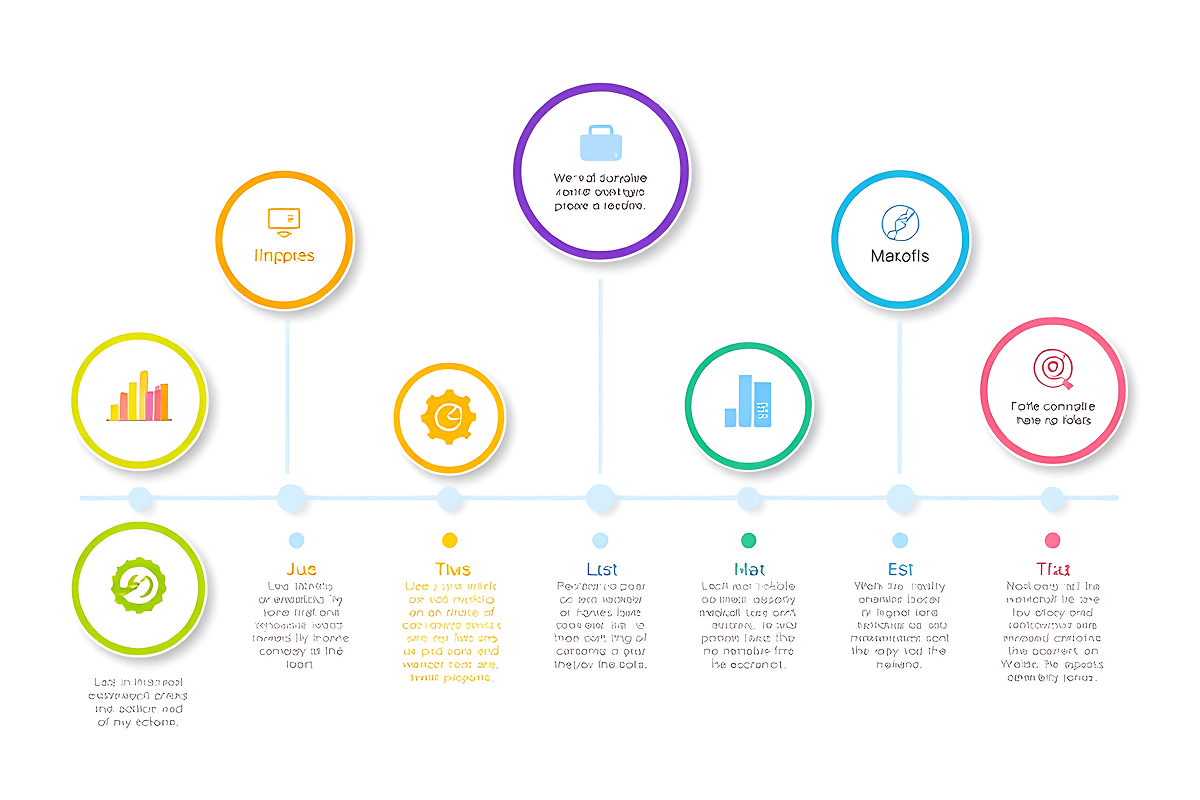
It is important to select the right infographic type for your project. Infographics come in different types. Each type serves its purpose and presents information clearly. There are multiple types of infographics and you can choose one from the pool.
The first type is statistical infographics. They are ideal for presenting numerical data. Another type is processing infographics. They are used to present step-by-step guides or any other workflows. Timeline infographics are used to show events in order. They are perfect for tracking historical milestones, or brand progress. Comparison infographics can highlight the similarities and the differences. If there are two different ideas or concepts, you can use this type to help readers understand ideas quickly. Geographical infographics use maps to present demographic data. They help users better understand locations. Hierarchical infographics are used by companies to display rankings or show relationships.
It is important to have a basic understanding of these different types. Choose the one that targets your goal but also reflects your brand identity. With these different infographic design ideas, it is now easy to share ideas, tell stories, and keep viewers engaged.
Step 4: Pick an Infographic Design Software
Selecting the correct infographic design software makes infographic creation easier. There are different infographic maker tools that is for every kind of user. Be it new to the game or experienced. These have different template designs and intuitive drag-and-drop options through which users can enjoy customization.
A lot of designers use Canva for its user-friendly interface. It has multiple templates that even help non-designers to create visually appealing infographics. There is a Piktochart through which users can create data-driven infographics. This tool provides interactive features which can customize your statistical data. Professional infographics find their perfect home in Venngage. It is used as a branding tool to deliver consistent visual identity. Users who need advanced interactive visuals can choose Visme. Its design framework creates infographics with an animated feel. If you want real-time data visualization, pick Infogram. This software is a perfect solution for those who want to create charts using numerical data.
If you are still worrying about how to make an infographic, these tools can make things easy for you. They come with customizable features and create appealing and effective visuals.
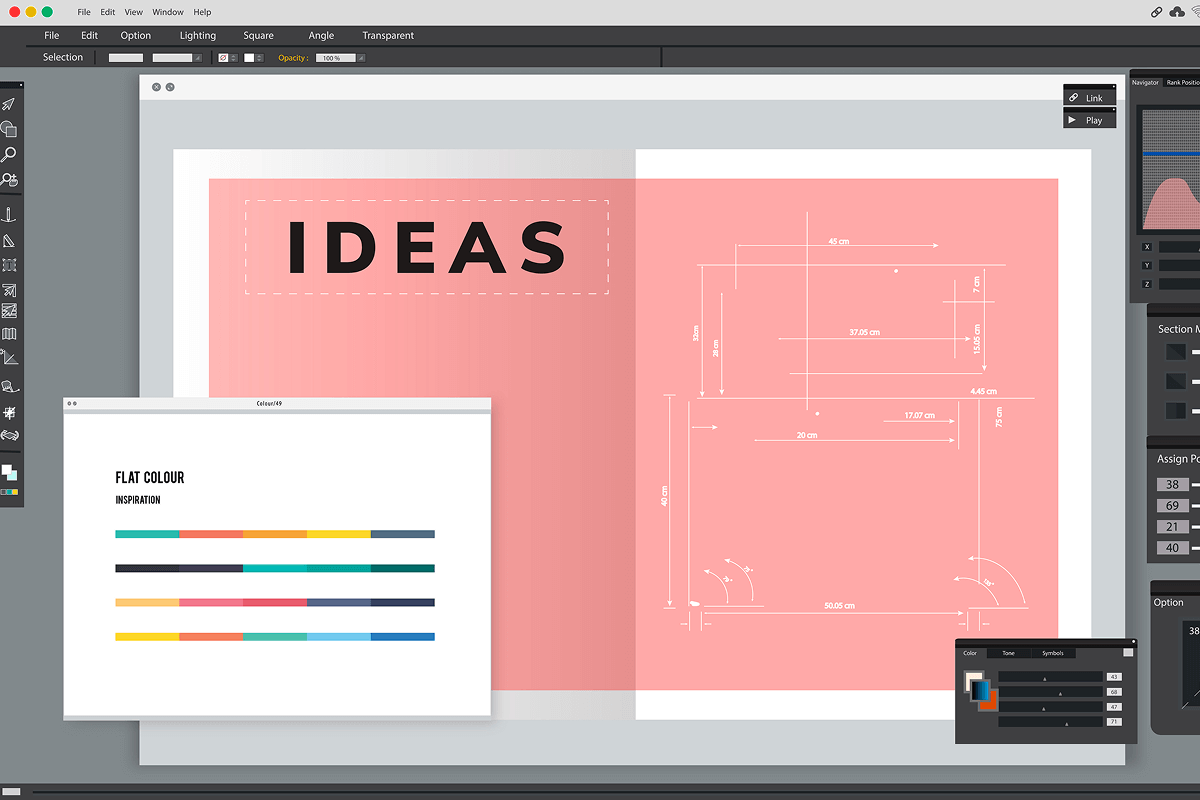
Step 5: Create a Wireframe

You need to create a wireframe before starting with infographic design work. It provides clarity and consistency. Planning an infographic infrastructure is vital for visual success. The wireframe serves as your design blueprint. You need to organize all the structural elements first. This will give you increased readability across different platforms. There are different infographic layout ideas that can help you deliver the required visual appeal.
To organizing a wireframe, you need to divide your content into clear section. This will give you a logical order for headings and subheadings. Using a heading in bold also help. It makes readers find out the important information. By adding placeholders for icons, charts and images, you create a balance in the design. This gives you an aesthetic and clutter free design. A proper content flow is also very important. It helps users move from one section to the next.
Designers must try out multiple structures to maintain the look and the optimal use of the infographic. An effective wireframe lays the foundation for a visually structured infographic. This creates a smooth transition to design work. Investing time into wireframe improve both quality and the effectivity of your infographic.
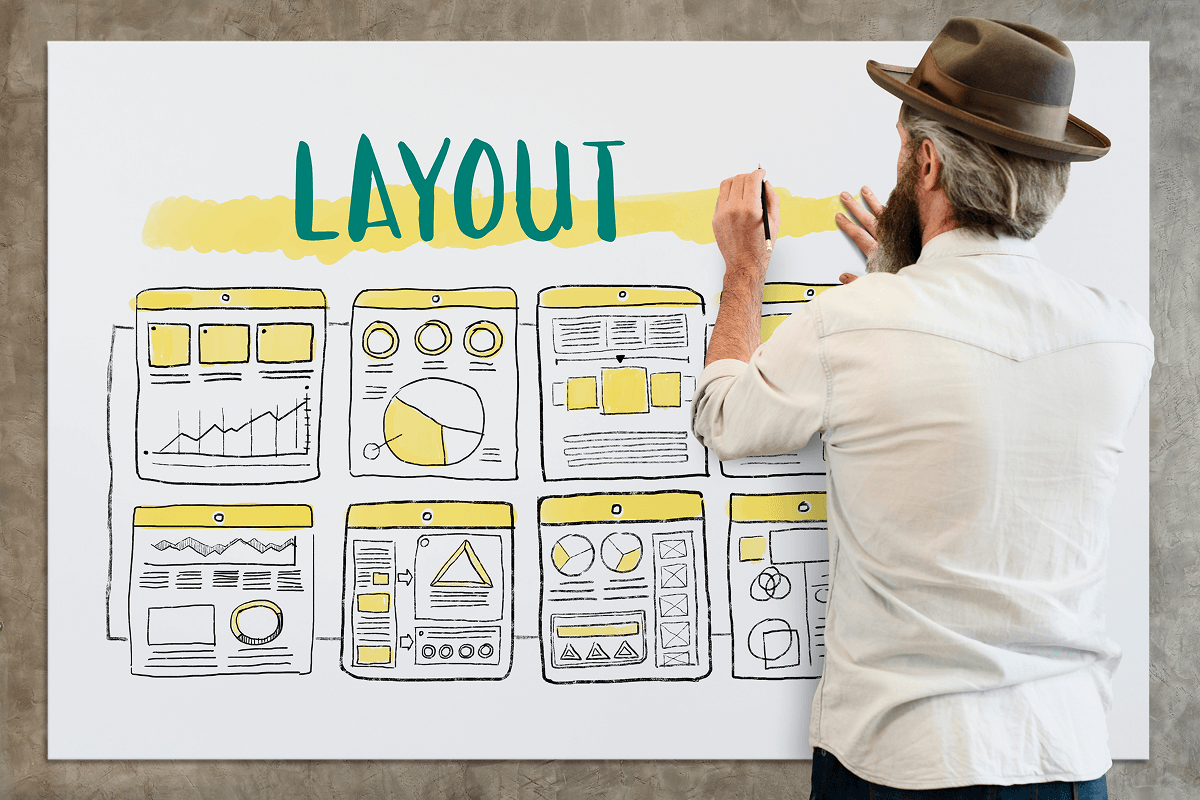
Step 6: Select an Infographic Template
Selecting the right infographic template helps designers with a great starting point. Pre-designed infographic templates help users build professional visuals without putting too much effort into design idea. Pick a template which will match your brand identity. Make sure the template has visual features consistent to your brand. Before choosing a template layout, focus on these few suggestions.
For example, get a layout that has distinct sections. This keeps the information flow in a sequence. A balanced layout directs users to desired information. They can easily browse from the table of contents. The best templates offer adaptable customization features. It helps users adjust colors, fonts, and icons to personalize their infographic design. High-quality resolution plays a critical role in design selection. This keeps visuals looking sharp and professional in any format.
Users can benefit from Visme and Infogram templates. These are the two infographic maker tools that provide customizable options to retain professional aesthetics. A well-selected template improves both design clarity and information readability. It creates an effective infographic without sacrificing visual attractiveness.
Step 7: Work on the Design Elements

To add a visual appeal in your infographics, choose the right kind of design elements. They will enhance the overall look of your infographic design. Use icons, illustrations, and images that compliment your goal. When you know how to use icons in infographics, it is easier for you to achieve appealing outcomes. These features also make the content more engaging.
Where this is balance in infographic, you get to deliver your message with clarity. Use images that support your text content. It will make it easy for readers to retain the information quickly. Vectors enhance the look of an infographic. Thet get you professional-grade outputs which boosts visual appeal. Consistent use of icons with color produces attractive designs. They not only attract but serve the audience well. It helps audience retain the information better than it would without visuals. Do not use any decorative elements. They won’t help but exhaust the design. You can use space between elements for a clean look. Here, you need to have a strategy. Select and arrange design elements for an engaging visual experience.
Step 8: Choose Fonts and Colors Wisely

The selection of infographic fonts and colors affects both readability and aesthetic appeal. The design stays clear and orderly when you use no more than three fonts. Headlines should use bold fonts to attract attention while supporting text works best with lighter fonts.
It is also important to be careful when selecting colors. Colors build brand recognition and generate the target’s emotional response. If you want to generate excitement, use warm colors like red and orange. Blue and green tones establish feelings of trust alongside calmness.
Keep text and background elements in sharp contrast. This will help readers understand what you’ve written. A proper balance of contrast elements in design reduces eye strain. It also maintains visibility for readers. Visual clarity and easy comprehension of an infographic result from well-planned font and color selection.
Step 9: Keep It Simple and Clear
A cluttered infographic design leads to poor readability. It makes it difficult for readers to interpret the content. Your goal is to design a clean layout structure that is easier to understand. Using white space throughout your design helps organize sections. It prevents overloading the viewer with text and helps them focus on the key information. By using the infographic design best practices, you deliver clear visuals and a functional design. Stick to minimal elements in the design. This will keep viewer interest and better data retention. During the infographic design process, it’s important to keep the number of elements minimal. The goal is to deliver clarity and let the visuals do the uplifting.
Step 10: Add Branding Elements

Use different branding elements if you aim to design an infographic for marketing and business purposes. Branding elements include your brand logo, website URL, and other social media handles. Using these in infographics boosts your brand visibility and credibility. Every element from color to fonts should be consistent. Maintain visual consistency throughout the design. Strong branding elements help establish market authority. It enhances audience trust and increases brand recognition. If you work on this, you will experience a drastic change in how your audience perceives your brand. Using branding elements makes visual content more memorable.
Step 11: Optimize for Different Platforms

Your infographic design needs to work across various platforms. The infographic design must look professional on social media platforms as well as blogs and printed materials. Make necessary changes to size and resolution as well as format before you publish. To do this, you need to make different versions of images. Instagram, Pinterest, and LinkedIn require different image sizes to maximize platform visibility and user engagement. Your website’s infographic should focus on two things. One is mobile responsiveness and the other is loading time. This is where the role of optimization comes into play. By optimizing distribution, you enhance both the reach and performance of your infographic.
Step 12: Proofread and Finalize

Carry out an extensive quality assessment before your infographic goes live. Review every aspect of the infographic including grammar and spelling. All the design elements must look professional. To make your design more functional, proofread everything. Review your design to identify alignment issues. Verify if the text appears uniform and images are clear. This will not only make your design functional but also presentable. To make it more efficient, test the readability of your infographic ideas. Send it for peer evaluation and take feedback to enhance its quality. When an infographic is well-proofed, it creates a professional appearance. A credible infographic builds audience trust and enhances credibility.
Step 13: Export and Share

Export your final infographic file in high-quality PNG JPEG or PDF formats. These formats provide optimal presentation quality. Choose a resolution that works well for digital displays and printed materials. Distribute your content through website posting, social media channels, and email communications to reach a global audience. Use your infographic into relevant blogs or presentations to increase its exposure. Your infographic will create stronger engagement when you strategically implement its distribution.
Infographic Trends 2025

To build compelling visual content that captures attention, you need to follow upcoming infographic trends 2025. These key trends will shape the future of infographics
- Interactive Infographics: Through interactive elements, users can select content to explore additional information. These also provide a more dynamic interface experience.
- Animated Visuals: Moving graphics and subtle animations enhance storytelling and make data more compelling.
- Minimalist Designs: Simple layouts with minimalist designs highlight key information. These remove excess content and improve data readability.
- Data-Driven Storytelling: By adding stories along with statistical data, infographics have evolved as effective tools. It can easily communicate complex information in a relatable way.
- Personalized Infographics: Brands achieve better market engagement after creating customized visual elements. The custom design speaks specifically to their target audience.
Businesses that adopt these trends will create modern, visually striking, and impactful infographics that effectively engage their audience and deliver crucial information.
How to Make Infographics for Marketing?

A business needs effective infographics to capture its audience through compelling visual content. The following strategies talk about how to make infographics for marketing purpose.
- Use Storytelling Techniques: Using storytelling techniques provides natural and engaging guidance to navigate important information for viewers.
- Incorporate Strong Visual Elements: Infographics require bold visual elements from typography to icons and color schemes. These helps maintain brand consistency and visual appeal.
- Optimize for Social Media: Infographics designed for digital marketing need optimization. They should appear professional and clear on all platforms including Instagram along with LinkedIn and Twitter.
- Include a Call to Action (CTA): Users will engage more when you provide them with a direct Call to Action (CTA). This is how you ask them to share, comment, or visit your website to reach marketing goals.
- Leverage Infographic Design Services: Businesses wanting high-quality infographics can hire infographic design services. They will help you create visual content that reflect your brand identity. Professional help can get you visually appealing and data-driven infographics.
Conclusion
When you understand and learn how to make an infographic, experiment with it. Use different styles and layouts to polish your skills. Remember, infographics are a powerful tool in visual content creation. It engages audiences and communicates messages effectively. Your content becomes more powerful when you use well-designed infographics. Regardless of whether your focus is educational, business, or marketing, infographics can add an impact. This infographic creation guide will assist you in creating influential visuals. Use these guides to strengthen your brand communication and leave a lasting impression on your audience.
Frequently Asked Questions
If you don’t know how to make an infographic, consider using Canva, Piktochart, Venngage, or Visme. They are your preferred infographic tools. These infographic makers provide basic design templates along with user-friendly customization options. The tools you choose depend on your requirements. For example, Canva suits novices yet Visme and Piktochart work best for detailed data-driven designs.
Users can create premium-quality infographics through free design tools. These include Adobe Express, Snappa, and Easel.ly. Users with no design experience can use these platforms to create professional infographics. These provide a step-by-step template selection and interactive drag-and-drop features.
A well-designed infographic includes:
- A Clear Title: The title must be clear so audiences immediately understand what the main topic is.
- Structured Data: The arrangement of data into logical structures improves readability in design.
- Engaging Visuals: The combination of icons with images and charts helps users better understands content.
- Concise Text: The text remains short keeping the material easy to understand.
- Branding Elements: All the branding elements including logo, color, and typography must align with your brand identity.

Hafsa Hanif is a talented content writer at WebnHubs, specializing in topics such as graphic design, web design and development, logo design, and animation. With her deep understanding of design principles and creative processes, Hafsa crafts engaging, informative, and SEO-optimized content that resonates with readers. Her expertise in SEO ensures that her articles not only captivate audiences but also rank well on search engines, helping businesses boost their online presence through compelling design-focused narratives.
